Bring Your Own Data: Upload Custom Market Series
By Lauren Boland | May 19, 2026
Hey Proofers! This is a release that is sure to be popular with a particular kind of spreadsheet geek. You can now upload your own historical market-returns data into FIREproof and use it in any simulation, the same way you'd use the built-in S&P 500 or 10-year Treasury series.
The curated catalog covers the big indexes, but it has limits. International developed and emerging markets, small-cap and value tilts, sector sleeves, real assets, factor portfolios, hand-collected international history; if you have a series you trust, you should be able to model with it. This feature lets you do that without me having to license, vet, and ingest every dataset by hand.
Here's how it works.
Why custom data
FIREproof has always shipped with a curated catalog of historical-returns series. That catalog is great for the common case, but it doesn't cover every series people want to model. Factor tilts, international sleeves, sector portfolios, private fund streams, hand-curated long-history splices; if you have a series you trust and have the right to use, you should be able to model with it. This feature gives you a generic ingest path that drops your data into the same engine the built-in series use. Your uploads stay private to your FIREproof account.
Concretely, that unlocks three things that used to be hard:
- Modeling factor tilts (small-cap value, momentum, international ex-US) against real historical sequences.
- Using a series you've personally hand-built or curated, like a long-history international splice or a private fund return stream.
- Reproducing what your favorite Bogleheads or PortfolioVisualizer workbook produces, but inside a full retirement simulation with taxes, withdrawals, RMDs, and Roth conversions.
What the file should look like
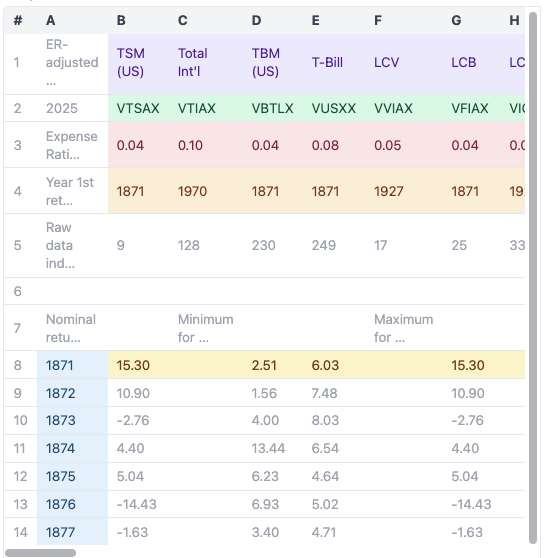
The uploader expects a generic year-down-the-side, codes-across-the-top layout. CSV and .xlsx are both supported, and the parser can pick out monthly or annual rows, and either per-period returns or raw price levels.
The simplest example uses the real S&P 500 composite that FIREproof already ships with. Here is what 20 years of that data would look like in a spreadsheet ready for upload, with column A as the year column and a single series column for the S&P 500 total return. The first four rows are the header rows the importer reads to set up the series, and the data starts on row 5.
| A | B | |
|---|---|---|
| 1 | code | SP500_TR |
| 2 | name | S&P 500 Composite |
| 3 | expense ratio | 0.0003 |
| 4 | first usable year | 1990 |
| 5 | 2004 | 10.9722 |
| 6 | 2005 | 5.2418 |
| 7 | 2006 | 12.2299 |
| 8 | 2007 | 4.4337 |
| 9 | 2008 | -40.6741 |
| 10 | 2009 | 26.5304 |
| 11 | 2010 | 11.8113 |
| 12 | 2011 | 0.1442 |
| 13 | 2012 | 14.3945 |
| 14 | 2013 | 27.1035 |
| 15 | 2014 | 13.6350 |
| 16 | 2015 | -0.0092 |
| 17 | 2016 | 9.3740 |
| 18 | 2017 | 18.5927 |
| 19 | 2018 | -3.6418 |
| 20 | 2019 | 23.7385 |
The colored cells correspond to the mapping fields the importer reads to set up your series.
- Code is a 1 to 64 character identifier (letters, digits, underscore, hyphen). This is the name you'll pick from in account allocation.
- Name is a friendly label.
- Expense ratio is decimal (0.0003 = 3 bps). The simulation subtracts this per year.
- First usable year is the earliest calendar year you trust the data. Older years fall back to the public proxy (sp500_composite for equity, ust_10y for bond).
- First data row marks where year-by-year returns begin. Everything above this row is header metadata; everything from this row down is treated as data.
- Year column holds 4-digit years, and the data values live alongside them.
Returns can be in either percent (15.298) or decimal (0.15298), and the importer picks the right one automatically based on the magnitudes it sees. You can also upload price levels (NAV or index level) and FIREproof will compute the annual returns from December-to-December changes. Monthly data is supported too; the importer chain-links monthly returns into one annual return per calendar year.
You can put many series side by side in one file, with each column representing a different series. PortfolioVisualizer "By Year" backtests, Bogleheads workbooks, and any spreadsheet you've built yourself will all work as long as they follow this general shape.
Uploading a file
The entry point lives in the sidebar under Custom Series. Click into the manager and you'll see your current list of uploaded series, with a button to upload a new one. If you've never uploaded anything, the manager is empty with a single call to action.
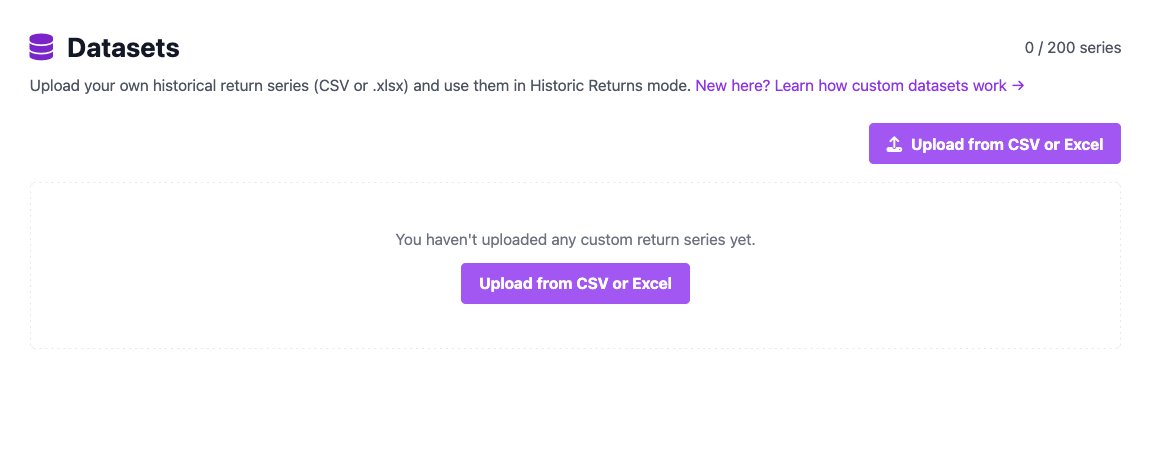
Screenshot: the empty-state Custom Series Manager, showing the title, the empty list with the call to action, and the "Upload custom series" button.
Click Upload custom series and you'll get a two-step wizard. The first step asks you to acknowledge that you have the right to use the data you're about to upload, and then lets you pick or drop your file. The acknowledgment checkbox is required, because once you click upload, the data becomes part of your private FIREproof account.
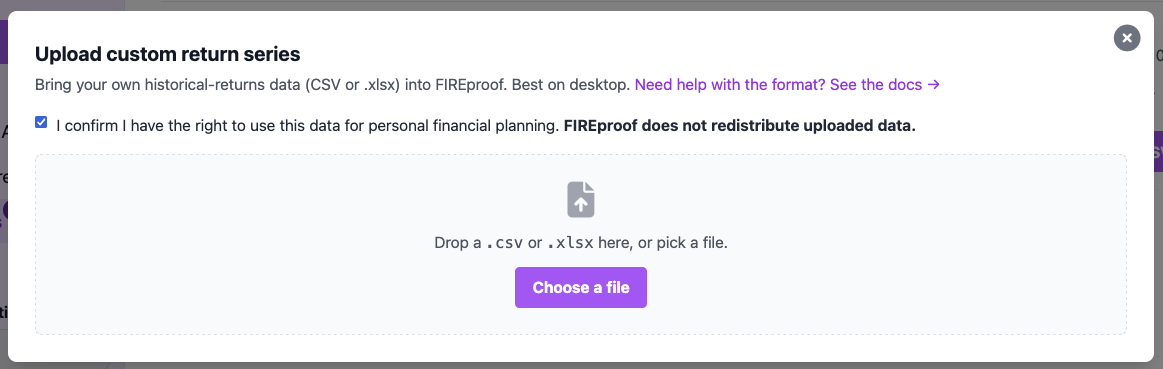
Screenshot: the upload modal in the "pick" step, with the acknowledgment checkbox visible, the dashed drop zone, and the "Choose a file" button.
Once you pick a file, FIREproof reads it and shows you a preview. This is the most important screen in the whole flow, because it's where you confirm that the importer has correctly understood your file's structure. The left side shows the mapping inputs (which row holds the codes, which row holds the names, where data starts, and so on), and the right side shows a preview of the actual cells from your file with color overlays that match each mapping field.
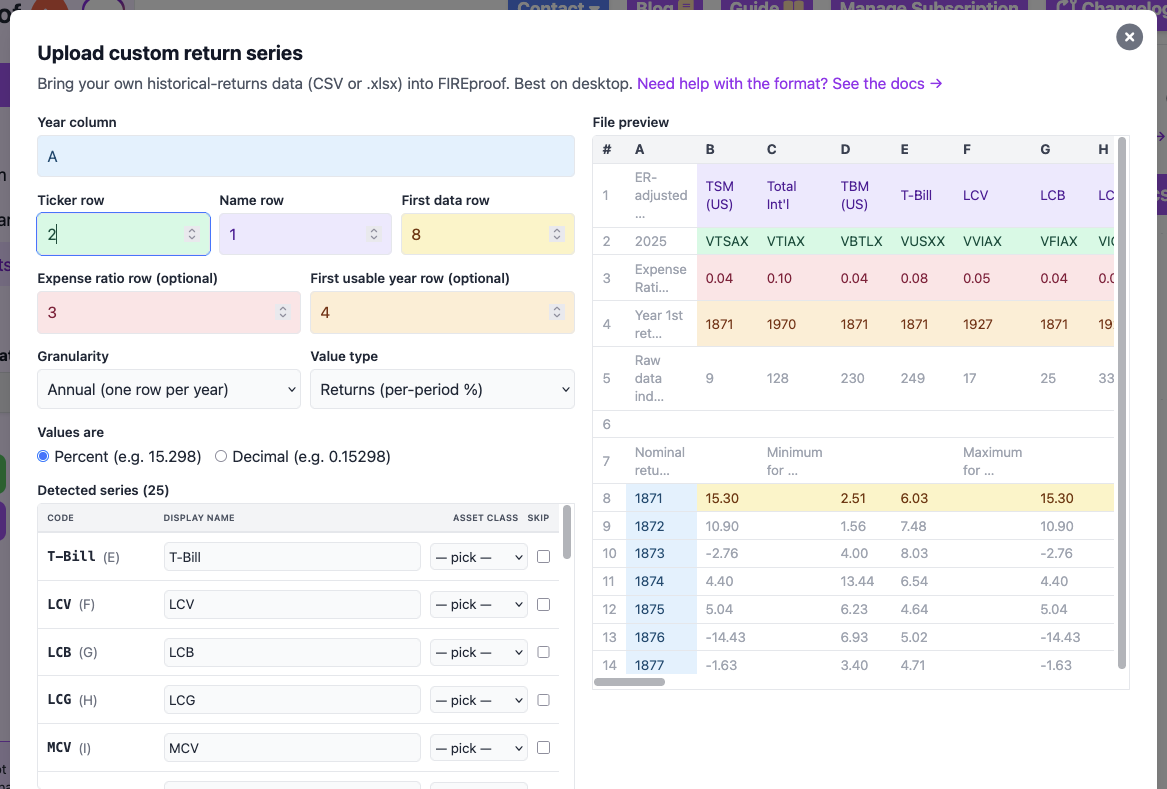
Screenshot: the mapping step with the inputs on the left (year column, ticker row, name row, expense ratio row, first usable year row, first data row, granularity, value type, percent vs decimal radio) and the colored preview grid on the right showing those same fields highlighted in the actual cells of the file.
The colored cells make the relationship between the mapping inputs and your file explicit. If the importer guessed wrong, adjust the relevant input and watch the highlight move to the right cells. This is also where you assign each detected series to an asset class (Equity, Bond, Real Assets, or Cash), and where you can rename the friendly name, skip a column you don't want imported, or see at a glance which codes will overwrite an existing series you already have.
Once everything looks right, click Commit. FIREproof validates the data one more time (no NaN cells, no codes that collide with the built-in catalog, no series longer than 200 years, no more than 200 series total per user), and writes the rows to your account. A success toast confirms how many series were imported, and any per-series warnings (such as a partial year that got skipped because December was missing) show up alongside it.
Using your series in a simulation
With your series imported, head to any account and open its Asset Allocation editor. Inside the picker you'll see two new sections (one for each asset class you uploaded into): Your custom equity series and Your custom bond series, alongside the built-in series. Your uploaded codes show up with a small "Custom" pill so you can tell them apart from the public catalog.
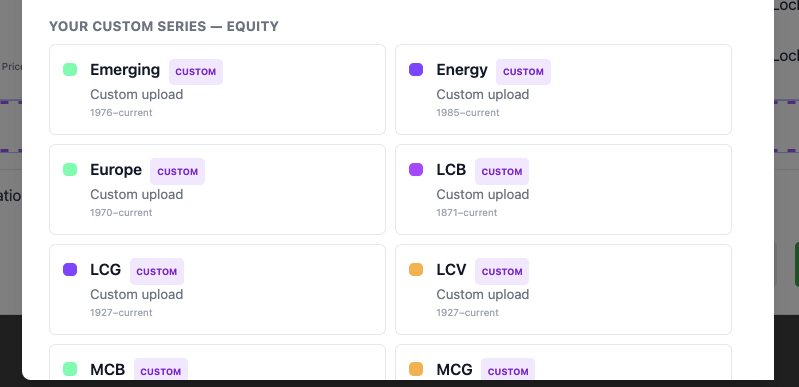
Screenshot: the Asset Allocation Picker modal inside an account, scrolled to the new "Your custom equity series" section.
Pick a custom series, give it a percentage, and run the simulation. The cycle engine reads from your uploaded returns for that ledger the same way it reads from the public S&P 500 series for the default sp500_composite row. Everything downstream (taxes, RMDs, Roth conversions, withdrawal planning) operates on those returns exactly the same way.
Per-series allocation pinning
One question I kept getting once the first round of beta testers started uploading data was: "I picked 60% S&P and 40% Small-Cap inside my equity sleeve, but by year 30 the chart shows it at 75% S&P and 25% Small-Cap. What happened?"
The answer is that the FIREproof rebalancer was holding the aggregate equity target steady (75% of the portfolio, say), but inside that 75% it let the within-class mix drift wherever the differential returns took it. If large-cap outperformed small-cap during the chosen cycle, your tilt drifted toward large-cap, even though you intentionally chose a 60/40 split inside equities.
To fix this, this release also ships per-series allocation pinning. When any asset class holds more than one series, the glide path editor now shows one line per series instead of one line per class. You can drag any line to set its percentage of total portfolio target, and the rebalancer holds that target year-over-year for the full simulation horizon. The percentages auto-renormalize as you drag, so the total always sums to 100%.
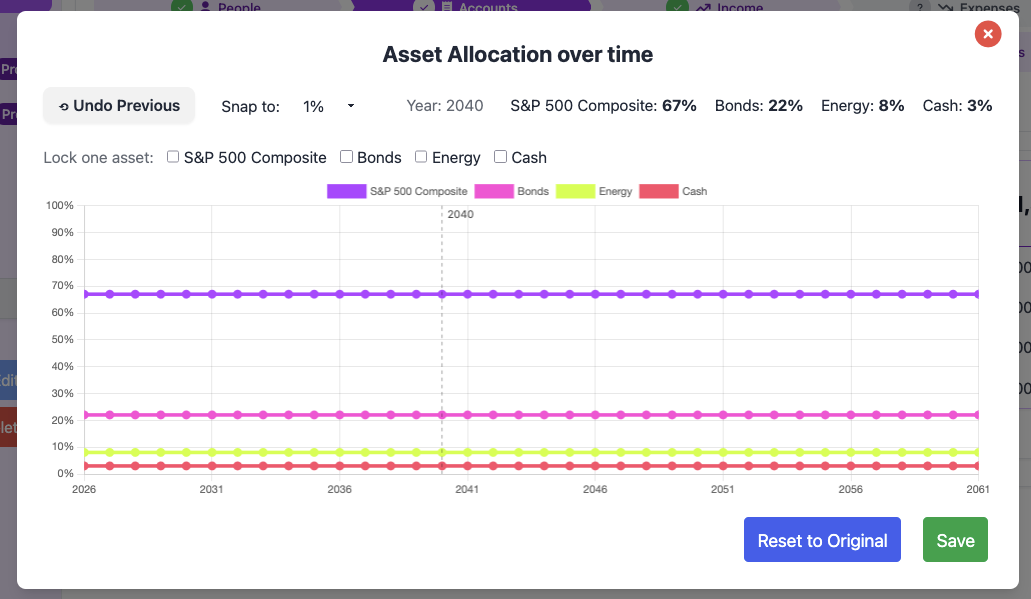
Screenshot: the "Asset Allocation over time" glide-path editor with one custom series asset class active.
The chart lines are fractions of the portfolio, not fractions of the class. Setting "S&P 500 = 40%" and "Small-cap Growth = 40%" means your portfolio holds 40% in each series, and the equity class total just sums to 80%. Single-series classes (a bond sleeve with only one series, for example) keep showing one line per class.
Limitations and the data-rights thing
A few hard limits worth knowing about up front:
- Up to 200 series per user, 200 years per series, 10MB per upload.
- Custom series are private to your account. There's no share-with-another-user flow in v1.
- v1 doesn't support a custom long-history splice. If your series starts in 2000, FIREproof falls back to the built-in sp500_composite (for equity) or ust_10y (for bond) for the pre-2000 years of any cycle that reaches that far back.
- There's no cell-by-cell editing. To fix a bad year, correct the source file and re-upload. Matching codes overwrite cleanly.
- You must have the right to use the data. FIREproof doesn't and can't audit your data's license. That responsibility is yours.
The data-rights point matters and is worth reading twice. Many of the series that beta testers most want to upload (international developed and emerging markets, US small-cap, sector sleeves, factor portfolios) sit behind redistribution licenses that the original index providers enforce. Using that data inside your own personal financial-planning tool is fine. Redistributing it would not be, which is why FIREproof stores your upload privately and never publishes it.
Wrapping up
The shortest version of this whole post is: bring whatever historical-returns data you trust, drop it into FIREproof, and run your retirement simulation against it the same way you'd run it against the built-in S&P 500. Factor tilts, international splices, private fund streams, sector sleeves; whatever you've got, it should now be modelable.
If you hit a file format the importer can't handle, or you have feedback on the mapping UI, please reach out. This is the kind of feature that gets a lot better with real-world test cases, and I want to hear about every workbook layout that doesn't import cleanly.
-Lauren
Support this project!
FIREproof is now past v1.0.0 and I'm building it as a solo developer. A Pro subscription keeps the lights on and gets you early access to new features as they land. If you've found this useful, it's the best way to say thanks and keep this project moving forward.