
Risk-Based Guardrails: Spending That Targets Your Odds
By Lauren Boland | July 17, 2026
Hey Proofers! FIREproof just gained a new spending strategy, and it's the one I've been asked about more than any other: Risk-Based Guardrails. Instead of picking a withdrawal formula and hoping, this plan sizes each year's spending to a target chance of success, then watches your odds year after year. When your odds climb high enough, you get a raise. When they sink low enough, you take a cut. In between, you coast with inflation adjustments and nobody panics.
It's live now for Pro users, in the same Spending Plan picker as every other strategy. Before I show you around, I want to talk about where this idea came from, because I didn't invent it.
Where this came from
I first heard the phrase "risk-based guardrails" from Aubrey Williams of Open Path Financial, a financial advisor who has spent years pushing the FI community past the 4% rule. If you want the full pitch in his own words, his ChooseFI appearance (Episode 566, "Risk-Based Guardrails for Drawdown") is an hour long and worth every bit of it.
Aubrey's core observation is "everyone adjusts". No real retiree mechanically withdraws 4%-plus-inflation while their portfolio burns down around them; when things get scary, people cut back. The problem is that most people adjust blind, with no idea whether the market dip they're reacting to actually threatens their plan. The result is the worst of both worlds: retirees who underspend for decades because they're scared, or who slash spending in 2009 when their plan was actually fine.
Risk-based guardrails replace that anxiety with data. In Aubrey's framing, you use historical analysis to set thresholds ahead of time: the portfolio conditions under which you'd raise spending, and the ones under which you'd trim. Because a flexible plan can safely start from a higher withdrawal rate than a fixed one, the payoff he emphasizes is a double win. You can potentially reach FI sooner, and spend more once you're there, because you've agreed with yourself in advance about exactly when and how you'd course-correct. Knowing the adjustment rules ahead of time is what turns a scary market into a planned, modest response instead of a panic.
The same idea runs the guardrails engine inside Income Lab, the professional planning tool many advisors use, so this isn't a fringe theory; it's arguably becoming the standard way advisors manage retirement spending. What hasn't existed is a way to run it yourself against FIREproof's historical engine. So I built one.
Guardrails on risk, not on a formula
FIREproof already ships a guardrails strategy called Guyton-Klinger. But GK's guardrails sit on your withdrawal rate: when spending divided by portfolio drifts too far from where it started, you adjust. That's cheap to compute, but the withdrawal rate is a proxy. It doesn't know how many years you have left, what income is about to come online (Social Security, a pension), or whether a 5% withdrawal rate is reckless or perfectly fine for someone with your horizon.
Risk-Based Guardrails puts the guardrails on the thing you actually care about: your chance of success. Each year, FIREproof asks: "at this spending level, in how much of market history would this plan have survived the years I have left?" That number is your chance of success (CoS), and the guardrails are thresholds on it:
- Target (default 80%): the comfort level your spending steers toward. Your spending is set so the plan would have lasted in about 80% of history.
- Raise threshold (default 100%): when your plan would have survived every historical scenario, you're leaving money on the table; spending steps up until your odds ease back toward the target.
- Cut threshold (default 25%): you only tighten up when things get genuinely risky, when your odds fall this low.
- Recovery level (default 45%): a cut eases you back to a still-cautious level, not all the way to the target.
The band is asymmetric on purpose, which comes straight from the published risk-based guardrails playbook: raise promptly, cut reluctantly. A raise snaps you all the way back to your target odds; a cut only pulls you to the recovery level. A good year shows up in your spending quickly. A bad one costs you as little as the math allows.
FIREproof's chance of success is a historical frequency, the fraction of the roughly 113 historical start years in which the plan survives, not a forward-looking probability. When the app says 80%, it means "this would have worked in about 80% of history." Advisor tools that use Monte Carlo engines often run their targets in the 90s; FIREproof's defaults (80 target / 100 raise / 25 cut / 45 recovery) are deliberately wider because a historical engine resolves odds in steps of roughly one cycle out of 113. Narrow bands in the high 90s would whipsaw on data that granular.
Setting it up
Risk-Based Guardrails lives where every spending strategy lives. Open your simulation, head to the Spending Plan section, and pick "Risk-Based Guardrails" from the plan dropdown (this is a Pro feature, so non-Pro accounts won't see the option). The config form appears inline:
- Yearly Living Expenses: your starting point, the spending level the guardrails begin from.
- The guardrail band: a single draggable control with all four markers (Cut, Recovery, Target, Raise) laid out in order, with the danger zone shaded below the cut marker and the comfort zone shaded between target and raise. Drag a marker, or focus it and use the arrow keys.
- Adjustment speed: how fast you close the gap when a guardrail trips. "All at once" is the default; slower settings spread a raise or cut over several years to damp swings.
- Re-check frequency: how often the guardrails re-examine your plan. Yearly is standard.
- Spending floor and ceiling: hard dollar limits the guardrails can never step outside.
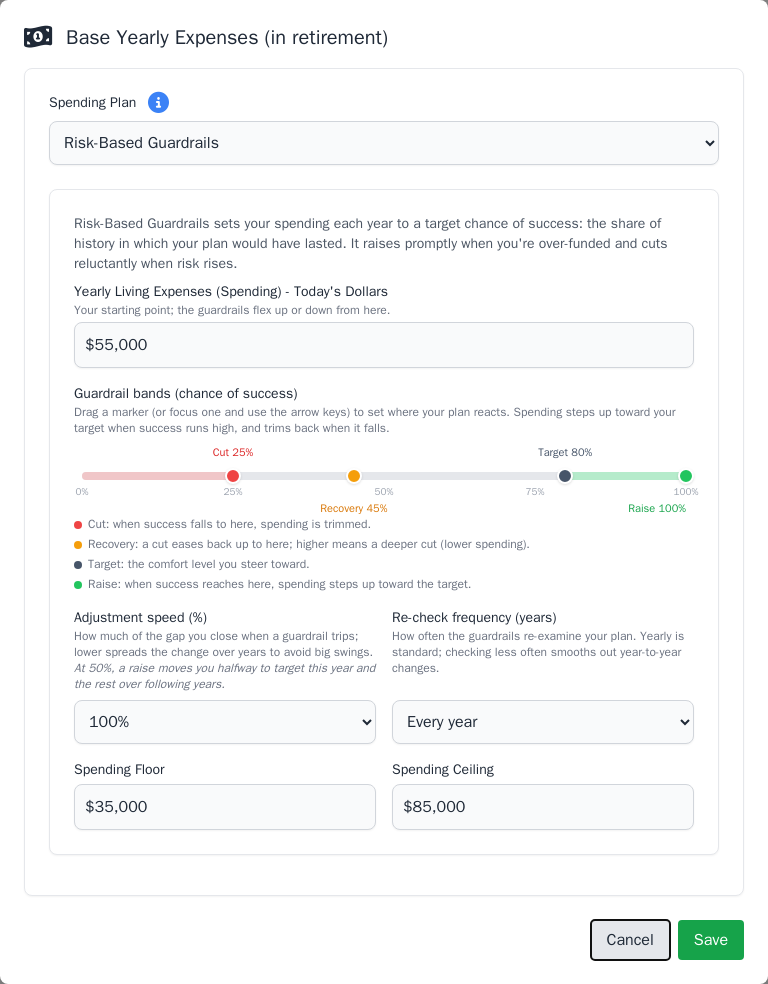
Screenshot: the Spending Plan section with "Risk-Based Guardrails" selected, showing the Yearly Living Expenses input and the guardrail band control with its four draggable markers (Cut in red at 25%, Recovery in amber at 45%, Target in slate at 80%, Raise in green at 100%), plus the adjustment speed and re-check frequency selects.
The form warns you (without blocking) if you drag the markers into an odd order, for example a recovery level at or below the cut threshold, which would mean a downturn-triggered "cut" couldn't actually lower your spending. One thing you will not find is a longevity or horizon input: the guardrails evaluate your odds over your existing Simulation Duration from Time Settings. Your plan length is a decision you've already made, and RBG respects it. As you age through the simulation the remaining horizon naturally shrinks, which is exactly why the guardrails can safely ratchet spending up later in retirement.
Running it
Under the hood, this feature is a simulation of simulations. To know your chance of success at a given spending level in a given year, FIREproof has to run forward sub-simulations from that exact portfolio state, for every candidate spending level, in every year, in every one of the ~113 historical cycles. Done naively that's millions of simulated years, which is why this analysis runs as a background job instead of the normal instant request.
When you open the Proof view with Risk-Based Guardrails selected, a dedicated panel appears at the top and the run starts automatically, with a real progress bar counting cycles. You can navigate away or close the tab entirely; the run continues on the server, and the result is waiting when you come back. In practice you'll wait longer than a normal Proof run, and most runs should finish in under 2 minutes.

Screenshot: the Risk-Based Guardrails panel at the top of the Proof view mid-run, showing the determinate "N/M cycles" progress bar and the note that the analysis keeps running in the background if you navigate away.
Below the panel you get the entire standard Proof view, not a stripped-down summary. You'll seethe success-rate headline, portfolio charts, statistics, taxes, allocation, and the year-by-year deep dive, all reflecting the guardrail-flexed spending. Drag the cycle slider to a retirement that started right before a crash (a late-1960s start is the classic stress test) and step through the years: you'll see inflation-holds through the ordinary years, a cut after the bad stretch, and raises as the recovery takes hold, always clamped inside your floor and ceiling.
Be sure to switch to the Spending chart to see the guardrail-adjusted spending line, which is the one that actually drives your odds of success. The
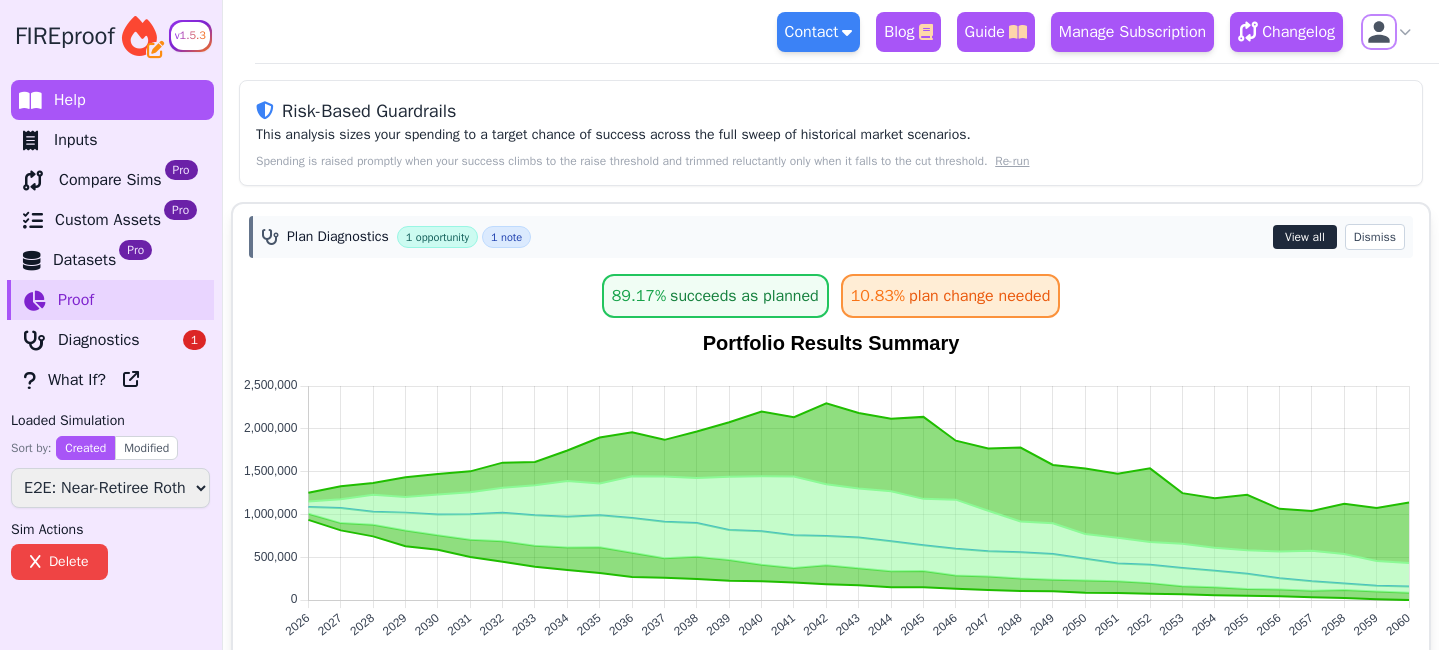
Screenshot: the full standard Proof view (success-rate headline, portfolio chart, statistics summary) rendered beneath the completed Risk-Based Guardrails card, demonstrating that an RBG run produces the complete normal output rather than a separate stripped-down report.
Results stick around, too. FIREproof persists the completed analysis keyed to your exact inputs, so revisiting the sim later (even after logging out) resolves instantly with no recompute. Change anything that feeds the simulation (a balance, an adjustment, a guardrail marker) and the next visit runs fresh. There's also a Re-run link if you just want to force it.
A few footnotes
- Risk-Based Guardrails is a Pro feature. If it's already the plan on a saved sim, it stays your plan regardless; the gate controls picking it, never destroys it.
- If your spending floor is genuinely unaffordable for the portfolio, the app says so: affected years carry a warning that the plan couldn't reach the target odds even at the floor, rather than quietly reporting a number it didn't achieve.
- Late in a long horizon there are fewer historical windows left to measure against, and the app reports the real sample size it used rather than pretending otherwise.
- The full explainer (what chance of success means here, the raise/cut asymmetry, and how the fast solver works) lives in the in-app help under Concepts → Spending Plans.
Wrapping up
The 4% rule answers one question: "what could I have spent, fixed forever, in the worst case?" Risk-based guardrails answer a better one: "what can I spend now, and exactly when and how would I adjust?" That reframing, which I owe to Aubrey Williams and the broader risk-based guardrails work his content introduced me to, turns retirement spending from a number you defend into a plan you steer. Go set your bands, run it against a 1966 retirement, and see how it feels to have the adjustments decided before you need them.
As always, I want to hear what you find. Surprising raises, cuts you disagree with, defaults you think are wrong.
-Lauren
Support this project!
Risk-Based Guardrails is a Pro feature, and it's a good example of where Pro money goes: it took a background job system, a new solver, and a lot of testing to make a simulation-of-simulations finish in seconds. FIREproof is built by one person, and a Pro subscription keeps the lights on and gets you features like this one the day they land.