
Monte Carlo Assets - Data for any Asset Class!
By Lauren Boland | August 13, 2025
Over the years, I have had so many people come to me:
Lauren, can you give me data for small-cap equities?
Pleeeease can we get crypto data in the simulation??
I cannot use this tool without the ability to add REITs to my portfolio!
So, when I started this project, one of the top things that I wanted to do was give users the ability to play around with a Monte Carlo simulation that had representation of assets that they had made. But the problem was, Monte Carlo simulations, for the most part, were reserved for actual data scientists or statisticians... and not me, who moonlights as a retirement data connoisseur.
But then I found a great Python library...
![]()
In short, Arch is a great tool that allows us to get a set of random data based on the mean (geometric average), standard deviation (volatility), and shape (based on historical data) of different asset classes.
In practice, what does that mean?
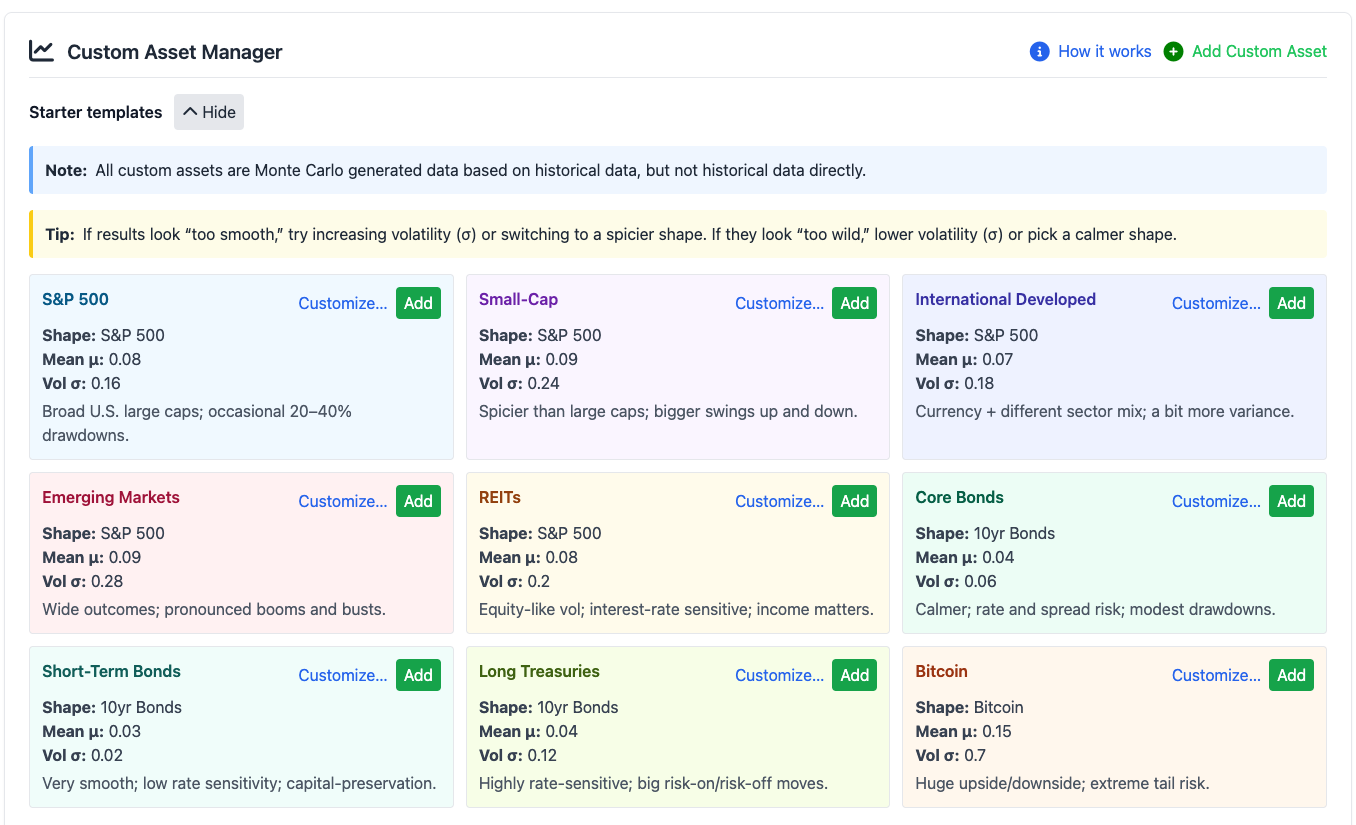
I've provided a UI located under Custom Assets in the sidebar. There, you will find descriptions of the process, starter templates of possible custom assets, and a list of all your specific custom assets. Once you've created an asset, you'll be able to add that asset to your accounts in the Inputs tab.
Wild times ahead
Let me set expectations. If you're not familiar with Monte Carlo simulations, there are more than a few caveats to consider.

More outliers: While Monte Carlo data generation is meant to feel like the real assets, outliers will appear that don't seem "real" to you. I've added a "Show/Hide Outliers" button on the primary Proof chart so that people can see the difference.
Different data each time: Due to the nature of random number generation, your outputs will be different each time you run them. You may view this as a pro or a con.
Tweaking data: While I did my best, with the historical data that I had, to create a group of predefined Custom Assets so that users could see different options, you're going to have to play with the inputs to make you feel good about the data.
False precision: Darrow Kirkpatrick and Chris Mamula over at Can I Retire Yet have a great series on reviewing different retirement calculators. Chris has talked in-depth about the idea of "False Precision" in retirement calculators. The general idea is that users will massage the inputs to make the outputs favorable, and that may not line up with reality. The same can be said with FIREproof, and especially when using Monte Carlo data. BE CAREFUL relying on generated data that you create. Know it's limitations. Don't plan your retirement around Bitcoin landing you 1000% yearly returns.
Current tax limitations: One of the current limitations of FIREproof is with it's Asset Allocation. By default, a simulation will maintain the asset allocation that it had at the start. What this means to your outcomes, is that if you have an extremely volatile custom asset, if that asset has a couple of outlier years of returns and increases by a LOT, the simulation will have to sell a bunch of that asset to maintain balance with your other assets. In testing, I had a few random outlier years of Bitcoin causing monumental gains and even more monumental long-term capital gains from selling. Be aware of these limitations.
I am super stoked to provide this feature to my Pro subscribers. This has been part of my vision for years, and it's great to finally get it out there.
-Lauren
Support this project!
This project is currently in Beta, but I'm including a subscription for a "Pro" version. Pro users will be the first to see new features, and will have a limited set of features available only to them. These subscriptions will support development of this tool and allow me to consider spending even more time on this project (Early Retirement anyone? A girl can dream).
